

Every day, business professionals hear and read about supply chain challenges. Late shipments, short shipments, extended lead times, customer order changes, and the like.
APICS and ASCM professionals designed computerized software planning systems for these moments. Yet, despite having been available for over 40 years, we still see some companies attempting to solve their supply chain problems with spreadsheets, muscle, and overtime.
Here are a few suggestions:
#1. Analyze and Reset Lead Times – Purchase lead times have gotten extended in reality, but does your planning system know this or is it using old, invalid lead times? If a purchased item’s lead time has gone from 6 to 8 weeks, it’s time to adjust. We recommend harvesting Purchase Order data from your ERP system and comparing actual, demonstrated values with those loaded in the item master file used by the planning system. Export them to a file and send them to your suppliers for confirmation. Sometimes that simple, collaborative exercise helps.
#2. Analyze and Reset Safety Stock Quantities – Safety stock guards against demand and supply uncertainty variability. The 2022 has hit us with a lot of both. There are many formulas for safety stock, but they all incorporate measures of variation in lead times and demand (usage). This data can also be exported from your ERP system. At a minimum, for each purchased and manufactured item, identify the range (minimum and maximum) lead time and weekly or monthly usage or sales if examining a saleable finished good.
Regardless of the specific safety stock formula your company chooses, wider ranges of lead times and wider ranges of usage will drive increases in safety stock quantities to maintain desired service and stock out levels.
If your company uses simpler Order Point (often known as min/max planning), recall that Order Points are set according to the equation OP = Demand During Lead Time + Safety Stock. The recalculation exercises above will help your company meet internal and customer demands.
If your company uses more advanced, time-phased planning techniques such as Material Requirements Planning (MRP) or Distribution Requirements Planning (DRP), resetting your lead times and safety stocks will also help, as well, but more needs to be done. We suggest the following exercises to shore up your MRP and DRP systems:
#3. Evaluate and Adjust Forecasting Models and Processes – Most forecasting models utilize sales history to forecast future demand. The question, however, is how much history. If a company uses 2 years of sales data, it’s using data from the outset of the Covid pandemic when fear was high. Demand was high for at-home goods, low for travel and leisure goods. Larger swaths of history smooth out spikes and troughs but, in the 2022 environment, we suggest using a limited amount of history to have a more market-responsive forecasting model, no more than 3-6 months of history during these turbulent times.
In addition to that simple exercise, now is a perfect time to see if your company is using the right model. Moving average forecasts are great for their simplicity but often miss or are late to detect trends or seasonality. Advanced forecasting software will run mathematical “competitions” that compare the fit of various models to sales history to determine the best fit.
Lastly, and this is the most crucial point, it’s crucial to align your company’s leadership’s business forecast with the grounds-up, nitty-gritty, item-based forecast. Suppose the last 6 months produced $25MM in revenue and 5% growth trend. Absent any new knowledge, mathematical models will project that data forward and produce item forecasts that, when summed, yield $26.25 MM for the next 6 months. Companies need to ask if this grounds-up forecast aligns with leadership’s budgets and Sales’ evidence from customer interactions. If leadership projects 10% growth, the historical data-based forecasts need to be increased, across-the-board or selectively. Forecasting is part science and part art.
#4. Evaluate and Adjust Purchase and Production Quantities (Lot Sizes) – Purchase and Production quantities, so-called “Economic Order Quantities,” are directly proportional to demand and ordering costs and inversely proportional to item unit costs and holding costs.
The classic EOQ formula is:
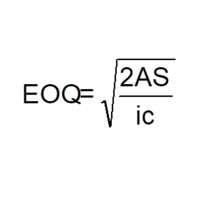
It’s important to consider each variable to determine if your company should be making or buying more or less of an item each batch.
- Annual Demand (A) – The discussion above on forecasting suffices here. Forecasted demand has a direct impact on production and purchase batch sizes for finished goods. For common, purchased raw materials, MRP calculates future usage for you. Absent those, look at recent usage/consumption history, no more than the past 3-6 months and set that as A. Higher A’s mean higher EOQs.
- Ordering Costs (S) – For manufactured products, ordering costs include the setup costs for each operation on a product’s routing plus an allowance for the overhead of scheduling and producing shop documents needed in production. With inflation running at 8.6%, it’s a cinch that your company’s ordering costs have increased. Setup technicians command a premium wage relative to just a few years ago.
Demand and Ordering Costs are likely to suggest increases in purchase and production quantities. Let’s examine the other counterbalancing factors: - Unit Costs (C) – These have also likely gone up due to inflation. In addition to the purchase price increase, unit costs also include costs like duties, tariffs, and freights to land the products at your dock as well as an allowance for the overhead in the Supply Chain Management Department. Those costs have all increased, too. For manufactured products, they include those costs plus direct labor and factory overhead both of which have increased in recent years. These factors would, independently, drive toward smaller replenishment quantities.
- Holding Costs (i) – Holding costs consider risk, capital, and obsolescence. Interest rates have gone up 8-fold in last year from 0.2% to 1.6%. All indications are that interest rates will continue to rise. So, like unit costs, holding costs on the rise also drives companies toward smaller replenishment quantities.
Summary
- Pick the right planning method – APICS/ASCM professionals know that MRP and Order Point are two distinctly different methods each with pros and cons. Each has a place in most companies. Learn the difference and apply each appropriately.
- Update the time-based planning parameters – Software-based MRP and Order Point methods depend on properly set inputs. Garbage in, garbage out. Now is the time to make sure MRP and OP logic have proper foundational data as inputs
- Update quantity-based planning parameters – The EOQ formula isn’t perfect, but don’t let perfection be the enemy of good enough. Calculate EOQs for your purchased and manufactured products and see if your actual purchase and production quantities are remotely in line with the EOQs. Use your judgment to explain or narrow any differences.
- Endeavor to replace Excel – Some joke that ERP isn’t short for Enterprise Resource Planning but that it’s short for Excel Replacement Program. Humor often has an element of truth. The planning modules of complex ERP systems aren’t for everyone. At the same time, custom Excel spreadsheets aren’t appropriate from most manufacturers and distributors of substance. Above, say a minimum of 30-50 employees or $10MM in annual revenue, companies should endeavor to utilize software-based planning and control systems.