


What is Economic Volatility?
 Economic volatility is often referred to in the context of the securities markets (stocks and bonds), and is a measurement of the dispersion of returns on a given security. It is the amount and frequency of price changes and how wildly they fluctuate (the standard deviation) from the average. Volatility can be caused by a number of factors including, but not limited to:
- seasonality
- emotions
- uncertainty
- legal and regulatory changes
- supply issues
- political factors
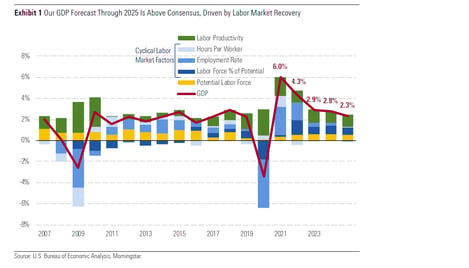
Each of these factors inform consumer spending habits and play an important role in the performance of revenue producing assets. The Covid-19 pandemic has created an environment where each of these factors have unevenly affected nearly every sector of the global economy. Within a business interruption context, this environment has made it challenging to project revenue and expenses into unknown periods. A recent look at GDP growth forecast and supply factors highlights the unevenness that the pandemic has created.
The initial impact of the pandemic continues through today as politicians grapple with how to inoculate the unvaccinated and reduce the impact of the pandemic and its overall effect. The impact is especially acute at the retail level, as companies struggle with increased commodity prices, a strained supply chain and a constrained labor force, all of which create substantial pressure on margins. On March 21, 2021, the Wall Street Journal reported, “delivery times for factory supplies have lengthened sharply over the recent months, and that has been reflected in a rise for the things manufacturers need to make their goods.” Given these dynamic variables, the business entity that sustained an interruption, and its industry, should be studied to truly understand how to project its revenue and expenses during these time periods. Factors to investigate include the geography of the entity, geography of its customers, the labor market in the local economy, and competition.
Volatility’s Impact on Different Industries
Part of the standard analysis when projecting revenue and expenses has been to look at the periods immediately preceding a loss (and further for longer interruption periods) to determine the demand for the goods or services of a business, the margin for the goods or services and the overall labor cost for the business. This model has been upended because the baseline look-back period has been so volatile and is not likely an indicator of the recovery of revenue levels to pre-pandemic amounts. This is especially true for interruptions that occur at the beginning or middle of recovery periods.
Some industry examples where the past performance has been different than what should be used to projected future performance include the following:
- Consumer Goods (Retail) – A multi-location urban footwear and streetwear retailer with relatively stable and modest growth over a 5-year period sustained a loss in June 2020 to several (but not all) locations during a period of civil unrest. The baseline historical growth (looking back several periods) did not provide reliable growth data to project the pandemic-related pent-up demand and stimulus spending that other non-loss affected stores clearly demonstrated. The non-loss affected locations outstripped historical growth by generating revenue of three and four times the prior years’ annual growth rates. However, this exponential growth was largely representative of pent-up demand that was not sustainable (or projected) for more than 3 to 4 months during the period of restoration. Any demand projected beyond that period proved to be more moderate, and industry data, along with non-loss related store revenue, was used to project the but-for analysis. Importantly, supply chain limitations and seasonal windows of opportunity were also factors that moderated the unprecedented and unsustainable growth once the economy began to open in the U.S. in the late spring, early summer of 2020.
- Service Industry – The service-related industry experienced a different, and more moderate, recovery following the initial pandemic decline in the Spring of 2020. This can be attributed to a number of factors depending on the industry, as healthcare services and hotels continue to remain below pre-pandemic levels given the inherent risk associated with both industries.
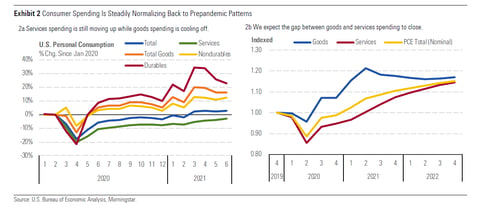
Importantly, hotel travel is driven by long range planning and business travel, both of which will have lagging impacts, creating a “recovery/performance drag” that moderates the time that it takes for the service-related sectors to return to 2019 levels. This is evident in the flatter slope of the service-related consumer spending that is shown on the U.S. Bureau of Economic Analysis Chart shown below.
Another example is nursing and rehabilitation facilities. The pandemic has changed the way care is acquired and administered to the elderly. The default has been sending patients to managed care facilities, but the shift to sending a patient home has become the new default as a result of the pandemic and other market forces, including how much Medicare will contribute to the overall cost.
The labor market has also played an important role in the moderation of restaurant and hospitality recovery, as employers struggle to hire workers. According to the Society for Human Resource Management, nearly 90 percent of 1,200 employers included in a survey had difficulty filling positions. This may or may not be related to the direct ongoing impact of the pandemic. Importantly, the reduction in the labor market should not be viewed without considering the “reallocation effect” or “cleansing effect”, as some employers recognize that they can achieve similar output with a reduced payroll count. However, this should not be viewed as a reduction in overall payroll dollars for some employers as labor supply/demand and inflationary impacts on payroll dollars need to be factored in to arrive at appropriate expected labor costs going forward. In other words, employer’s may be hiring fewer professionals to complete tasks, but the overall cost commanded by labor entrants may be higher, given their leverage and the overall increase in costs related to near term inflation.
The Right Balance of Empirical Data Allows for More Accurate Projections During Periods of Economic Unpredictability
Projections and forecasts, by nature, are part art and part science. The pandemic has highlighted how important it is for all relevant factors to be considered, weighed and then applied when projecting the operational performance of an entity during an uncertain economic period. Using the right balance of empirical data allows for the interpretation of what’s occurring in a specific sector or industry. Depending on the interruption, the data to be relied on may include trends specific to a business's revenue stream, macroeconomic sales tax revenue data that is specific to an industry and geography, competition data, post-loss data, and other relevant price indexes. The conclusions reached using different data points (industry data v. post loss data v. other location data) can all be tested against one another to arrive at reliable models to project what would have occurred absent a loss. Importantly, a deep understanding of the business whose operations are being projected is paramount to arriving at reliable conclusions especially during periods of unpredictable supply, demand and price. The true expert recognizes this and crafts their analysis so that any inconsistencies that exist between using different data sources are explained by risks and factors that are unique to a specific period and the volatile period in which they may be operating.

- https://www.wsj.com/articles/turbocharged-economy-leaves-factories-struggling-to-deliver-goods-that-shoppers-want-11615726803
- https://www.wsj.com/articles/covid-spurs-families-to-shun-nursing-homes-a-shift-that-appears-long-lasting-11608565170
- https://www.shrm.org/resourcesandtools/hr-topics/talent-acquisition/pages/labor-shortages-the-disconnect-solutions-unemployment-benefits-childcare-covid-fear.aspx
This article was co-authored by Joseph Tamburro.


